Overview
Our infra engineer noticed that an asynchronous worker server for one of our services was crashing with an out of memory (OOM) error. This service was responsible for queuing and processing background jobs.
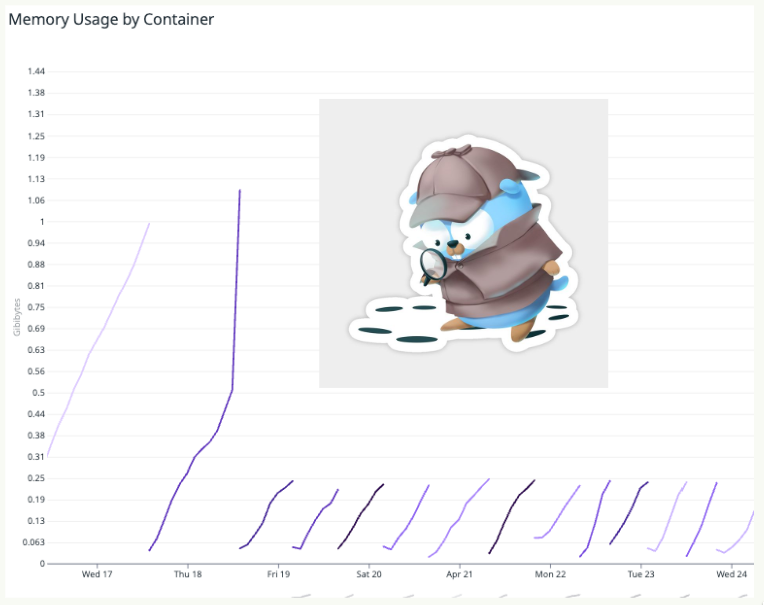
Upon examining the datadog logs, there wasn’t anything particularly alarming—just a “signal: killed” message. The memory consumption of the pod would steadily increase and then crash when it reached its threshold. The temporary fix was to allocate more memory to the worker server, but this was a waste of resources and didn’t address the root cause.
Investigation
I initially had a few suspects in mind:
- Our asynq worker was not removing the processed jobs from the queue, causing it to build up over time.
- Back-pressure from the queue was causing the worker to crash.
- A goroutine leak somewhere.
The first two suspects were ruled out fairly quickly since the workers were deleting the jobs within 24 hours and we didn’t have that many jobs running concurrently.
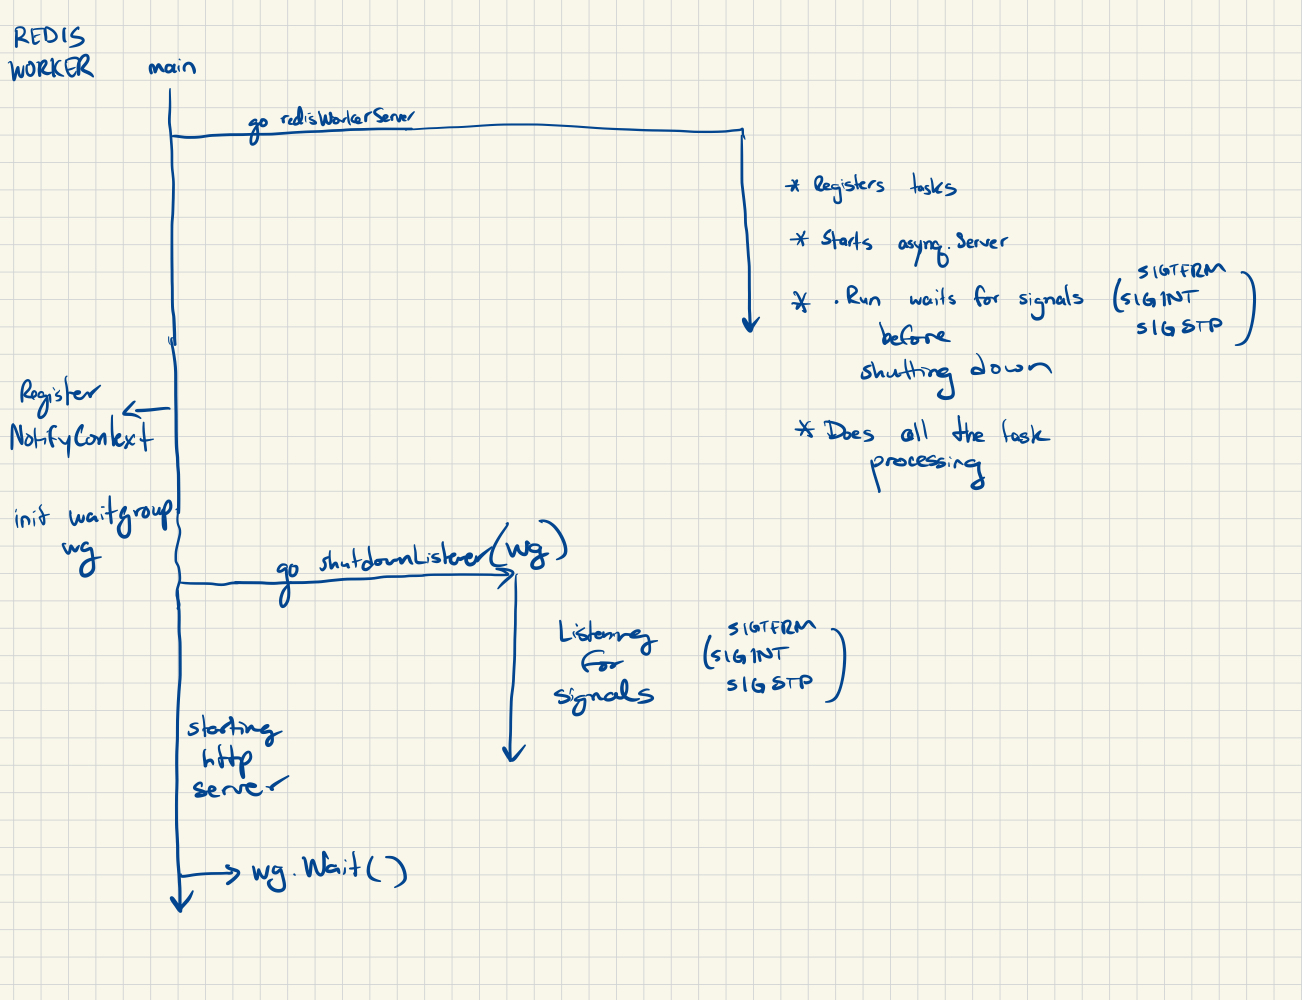
That only left me with a goroutine leak. I started by drawing out the application goroutines and how they interacted with each other:

Based on this initial pass at locating the goroutines, I couldn’t identify a potential leak since things looked in sync. The redisWorkerServer had its own signal listener (ie. listening for SIGTERM) and the main shutdownListener also had its own signal listener. Both would terminate if K8s sent a SIGTERM signal.
Where was the mysterious memory leak coming from?

Asking for help
Realizing I needed a fresh perspective, I reached out to the Golang slack channel and provided a detailed explanation of the issue. A seasoned gopher suggested using pprof, a powerful profiling tool.
pprof helps analyze and visualize performance characteristics of your program.
This includes the ability to generate a:
- CPU Profile
- Memory Profile
- Block Profile
- Goroutine Profile
These profiles help identify resource consumption hotspots within the codebase.
Using pprof
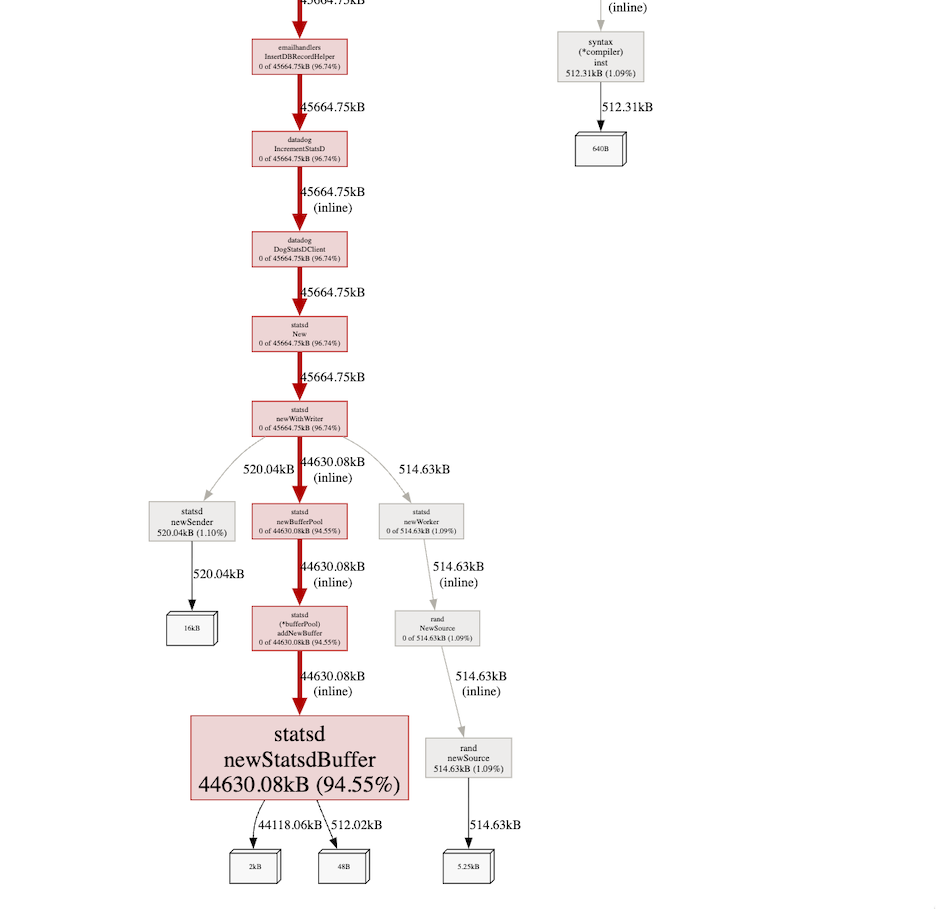
When I initially used pprof, the volume of information was overwheling; memory addresses, stack traces, heap allocations, and more. Luckily pprof has a web interface that makes it easier to navigate through the data. By running go tool pprof -http=:8080 http://localhost:6060/debug/pprof/heap, I could see the visual representation of the memory allocations for each code block.
I had many asynq tasks that were sending emails as well as utilizing DogStatsD to send metrics to Datadog. In pprof, I noticed that there was a suspicious amount of memory being allocated by the newStatsdBuffer function.

Upon further inspection, I noticed that we were initializing a new statsd client not only when a job was being processed, but also when the job would retry. When executing the command that kicked off the asynq processing, I noticed that the number of goroutines would increase each time. The old goroutines were not closed properly because we weren’t actually closing the statsd client, but rather, only flushing the buffer during app shutdown via .Flush().
Solution
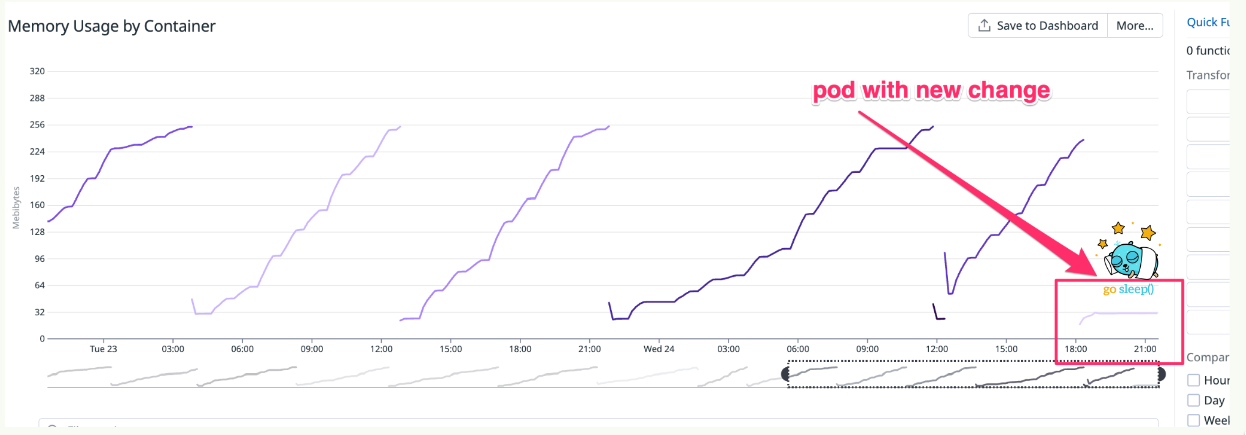
The fix was simple. Instead of initializing a new statsd client for each job, we would initialize it upon app startup and reuse it across the application. In addition, we’d .Close() the client upon app shutdown, which would close the connection and flush the buffer. The resulting dashboard was delicious 😋

The original code was written early in my Go journey, so it was nice to address this inefficiency and learn a new tool in the process.